UK Manufacturing Output , July 2023: The Office for National Statistics (ONS) released the latest data on manufacturing output this week, showing a fall of -0.7% in July (compared to the previous month); however, we prefer to look at the rolling 3-month trends as that takes out some of the natural volatility in monthly data – this showed manufacturing output in the latest 3 months (May, June & July) was +1.7% higher than in the previous 3 months (February, March and April) and +1.8% higher than in the same months of 2022.
For the monthly series, the pre-pandemic comparison month is February 2020 and manufacturing output in July 2023 was at 103.1% of that base level.
Once again, it is the capital goods industries that are leading the way; despite a fall of -0.3% in July, output of this group in the latest 3 months was up by +3.4% on the previous period and +6.8% higher than a year ago. This is the best performing of the manufacturing sub-sectors at the moment, although it partially reflects the weakness of a year earlier as well as current strength. As a result of this growth, the July output figure stood at 103.6% of its pre-pandemic level.
The key to this comes in the industries that we track and, in particular, the automotive industry where output in the latest 3 months was +11.4% higher than in the previous period and +19.9% up on a year ago. This is mainly explained by the continued working through of backlogs caused by the supply chain shortages for electronic components. This strength may well have a little longer to run as July output was only 85.8% of its pre-pandemic level, although demand weakness will start to be a factor balancing the impact of supply chains easing.
The trends were also positive for the metal products and aerospace industries. Metal products, a significant proportion of which reflects the activities of companies classified as metal-working sub-contractors, saw output in the latest 3 months grow by +2.4% compared to the previous period and was +5.3% above the level of a year ago. For aerospace, the growth rates were +2.0% and +2.9% respectively. However, these two industries have different positions relative to the pre-pandemic level with ratios compared to February 2020 of 92.8% and 103.2% respectively.
The other industry that we track is machinery and this is currently the weakest in terms of its current performance; although it had growth of +2.7% in July, output in the latest 3 months was unchanged from the previous period and -2.7% lower than a year earlier. The data for this industry currently shows very strong growth in the post-pandemic recovery and, as a result, the July level of output was 110.6% of the pre-pandemic level. However, the next data release will incorporate the ONS’s annual revisions (although the base year won’t change) and early indications suggest that this post-pandemic boom will be revised away, so we will have a very different picture when the August figures are published.
You can download the ONS Statistical Bulletin from their web-site at https://www.ons.gov.uk/releasecalendar (13 September) or request it from MTA; we also have an analysis of the key industries which is available to members – please contact Geoff Noon ([email protected]) if you would like these charts.
—————————————-
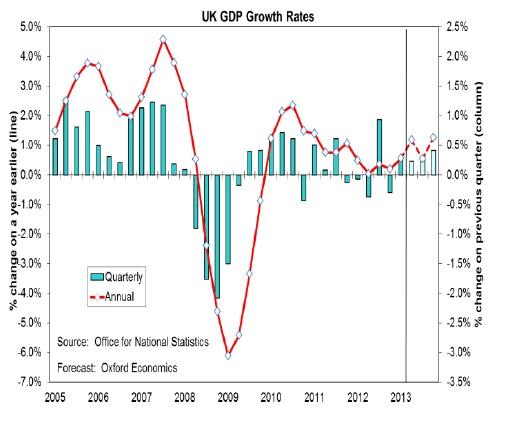
UK GDP, July 2023: As well as the data for manufacturing, the ONS publishes the output figures for the other major sectors of the economy – services and construction – and uses all of these to produce the estimate of GDP on a monthly basis. Somewhat to the surprise of most commentators, at least in terms of magnitude, the UK economy is estimated to have contracted by -0.5% in July (compared to June).
The main drivers of the contraction in July seem to have been strikes by teachers and NHS staff, with a lesser but still negative impact from the wet weather which affected both construction output and retail sales. The UK GDP data is on a somewhat volatile path at the moment with June having seen growth of +0.5%, mainly due to fewer strikes and a bounce-back from May which had an extra Bank Holiday. Taking the 3-month (May, June and July) rolling average to smooth out some of these issues, the UK economy is estimated for have grown by +0.2% compared to the previous period (February, March and April).
In the service sector, it is the five days of strikes by junior doctors plus two days by senior doctors that meant that human health & social work activity made the largest negative contribution to growth – 9 of the 14 sub-groups in the service sector saw GDP contract in July. Output of consumer-facing services was unchanged compared to July thanks to strong growth in sports & recreation activities balancing the negative trends in this group (not that health is not considered as “consumer-facing”). Taking the latest 3 months together, the service sector grew by +0.1% compared to the previous period.
The other major sector of the economy is construction and this saw output fall by -0.5% in volume terms compared to June. In part this is a reaction to the weather with a combination of good conditions in June (which boosted activity) and a rainier July creating a modest drag on output. Having said that, the fall in activity was entirely in repair & maintenance activity with new work edging up.
With output of the construction sector increasing by +0.1% on the 3-month rolling trend, all three sectors of the economy (see above for the manufacturing figures) contracted in July but were positive on the 3-month trend.
There are more details in the range of ONS Statistical Bulletins which can be downloaded from their website at https://www.ons.gov.uk/releasecalendar (13 September) or on request from MTA.